© Josh Sager – March 2014
As Justice Brandeis said, the individual states are laboratories of democratic policy. Instead of doing everything at the federal level and trying to pass standardized policies over diverse populations from different states, our system of government allows states wide latitude to implement their own ideas. Sometimes, these ideas travel to other states or the federal legislature (ex. Massachusetts’s RomneyCare was reborn as the federal ObamaCare) and sometimes they die because they are ineffective.
In this article, I will present many maps, detailing widespread trends including everything from education and health to income equality and happiness. These maps will draw a clear and distinct pattern, where states with conservative leanings tend to have poorer societal outcomes and states with more progressive leanings tend to have better policy outcomes.
…but first, we need to identify conservative and progressive leaning areas.

Before looking at the coming maps, make sure to note the general distributions of political power shown in the previous map: The conservatives have an iron grip on the deep south, Midwest, and mountainous northwest, while the progressives have control over the northeast and west coast; the southwest tends to swing right, while the northern Midwest and Great Lakes region have recently begun to swing left.
In the following maps, I will present you a color-coded view of the United States, illustrating patterns in health, education, and economic statistics.
The Human Development Index
The first map is color-coded based on a meta-measure of a society called the “human development index.” This index was created by the Social Science Research Council as a composite measure of the health, education and income levels within each state—the higher the number (or darker-colored the state on the map), the more developed the state.

Map created by the Measure of America project, using 2010 and 2011 data
If you want to explore the interactive version of this map, you can follow this link: https://www.measureofamerica.org/maps/
As this map clearly shows, the most developed states are clustered in the northeast, around the great lakes, and on the west coast, while the least developed states in our country are almost exclusively in the Deep South and Appalachia.
By comparing this map with the partisan power map at the beginning of this article, you will see a remarkable correlation between conservative power and stunted social development. If you consolidate the two lowest categories on this map, you will have with an area that includes virtually every conservative stronghold in the south and mountainous northwest (except Arizona). Similarly, if you take the two highest categories in this map, you end up with a map that is almost exclusively filled with states which are progressive or progressive-leaning (the exceptions being Arizona and Alaska).
Correlation is not causation, but this pattern is certainly striking. Given this data, it appears that one of two patterns is occurring: either conservative governance stunts social development or societies with lower levels of social development tend to elect conservatives.
Economy
Federal Taxes/Aid Comparison:
If the Republican Party is against one thing, it is welfare and the redistribution of wealth—at least, that is what they say on the campaign trail. In reality, conservative states tend to be the largest recipients of federal tax dollars, while more progressive states tend to contribute the most to the federal coffers.
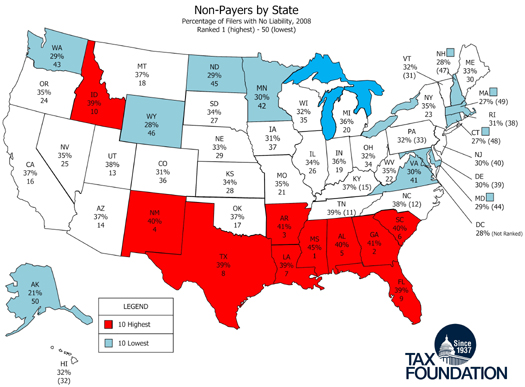
Map Created by the Tax Foundation, using 2008 data
As the previous map demonstrates, red state residents are far more likely to have no federal tax liability than residents of blue states—they simply don’t make enough money to be paying those taxes. This indicates that red state residents are the last people who should complain about federal tax burdens, as they are the people who tend to not to pay those types of tax (a majority of their tax burden is state and local).
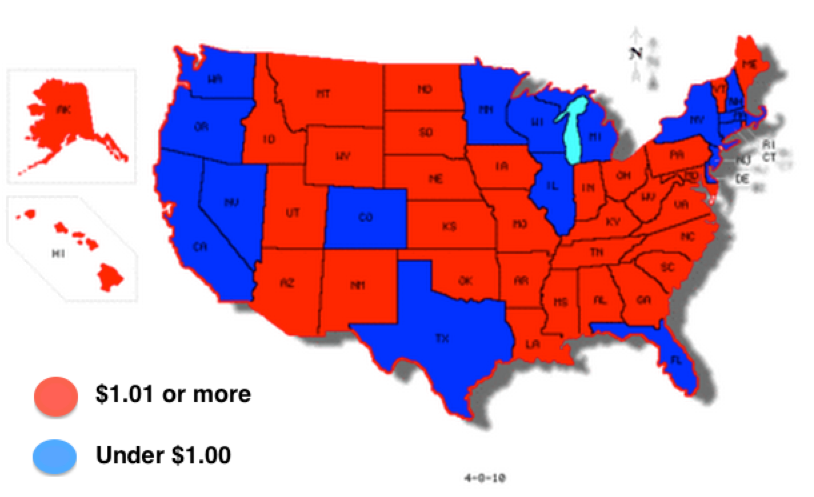
Color coding based upon amount of money received from the federal government in benefits or business for every $1 in tax revenue (red = net gain, blue = net loss)
Map created by Business Insider Online, using IRS data
As this map illustrates, red states are deeply dependent upon the federal government for money while blue states tend to pay more taxes than they receive in benefits. Conservative regions like the Deep South, Midwest, Southwest, and mountainous northwest tend to take more in federal dollars than they pay into the federal government through taxes. Conversely, the blue areas like the northeastern coastline and parts of the Midwest tend to receive less money than they pay in. There are certainly exceptions to this trend (ex. Texas has vast oil wealth, which boosts its input into the federal tax pool, while Maine is a progressive-leaning state which takes a lot of federal tax dollars), but this doesn’t invalidate the greater pattern.
Indeed, as politifact confirms, 28 out of the 32 states which take more money from the federal government than they contribute in taxes are conservative, while 14 out of the 18 states which contribute more than they receive are Democratic.
In the language of the right wing, this pattern means that red states are “takers” while the blue states are “makers.”

Map created by The Economist, using Census data from 1990, 2000, and 2010
As this map illustrates, the red state federal money dependency is a long-term trend rather than an acute situation brought on by an economic crash or natural disaster (looking at short-term data runs the risk of including events like Superstorm Sandy or Katrina that would skew the data with massive and temporary aid money)
Poverty:

As you can see in the previous map, American poverty is concentrated in the south, from Arizona all the way to the East Coast; additionally, Michigan, West Virginia and Kentucky are high-poverty states.
With the exceptions of Michigan and New Mexico, these states are exclusively conservative-leaning. Conversely, on average, more progressive states—particularly in the northeast—tend to be the most well off states in our nation
When looking at this pattern, it is important to note that there are city level objections that conservatives raise when presented with this data. They argue that poverty is concentrated urban areas of their states that tend to vote Democratic, thus the poverty isn’t reflective of the conservative mindset. Put simply, this argument is wrong for the simple fact that state governance is a major factor that helps determine the economic health of the entire state population. Red states tend to be hostile to unions, have low minimum wages, and spend less on infrastructure investment, creating a ripple effect into rural democratic strongholds that reduces the economic welfare of those living there.
Economic Mobility
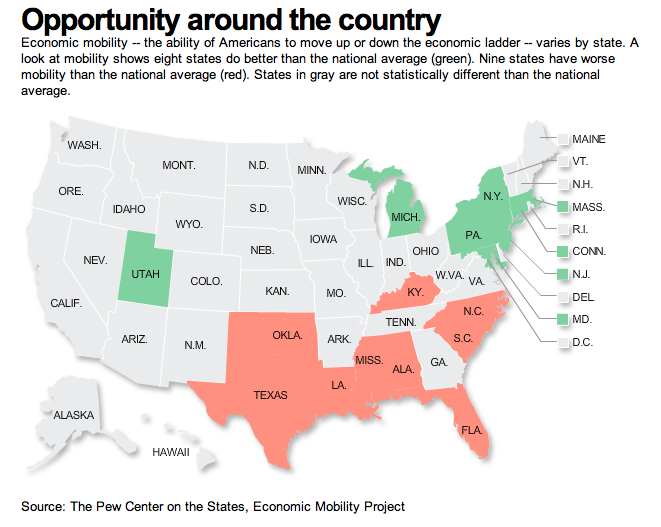
As you can see in the above map, income mobility and the ability to “work your way up” (or down) is tied to the state in which you are living. All but one (Utah) of the states which have higher than average upward income mobility rates lean progressive, while all of the states with low upward income mobility rates lean conservative.
This suggests that something about conservative culture, economics or social policies (ex. union busting, low minimum wage, poor regulations, low education investment, etc.) retards the ability of Americans to advance up the social ladder.
Education
High School Graduation
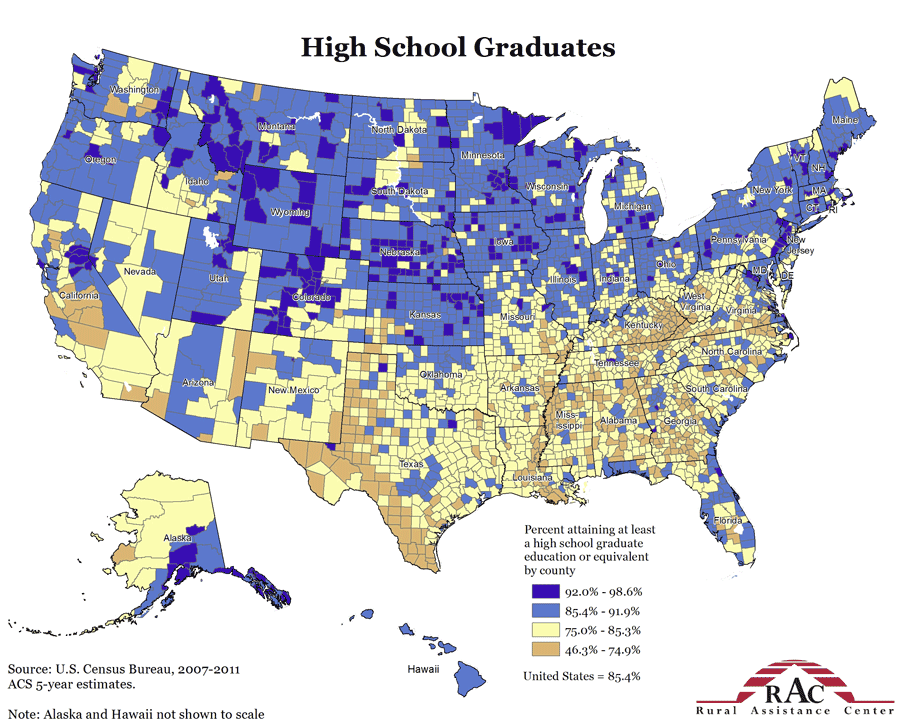
Map created by the Rural Assistance Center, using Census data
As is illustrated in the previous map, there are wide disparities in high school graduation rates, both on state and regional levels. For the most part, the northern United States has higher graduation rates, while the southern United States has lower graduation rates.
Unlike with economic issues, state-level graduation rates do not correlate purely along partisan lines—the left-leaning northeast, great lakes, and west coast regions are joined by the more conservative mountainous Midwest and plains states in the highest levels of graduation.
That said, on average, left leaning states tended to have far higher levels of high school graduation than right leaning states. The Deep South bastion of conservative governance is near-universally trailing the rest of the country, while the progressive northeast is leading the country (on average, the Rocky Mountain states have higher graduation rates, but they also have far lower populations).
Educational Investment
The disparity in high school graduation rates between the south and the north is not simply broken down into any one causal relationship. Educational achievement is influenced by a complex mix of schooling, culture, and economic wellbeing (ex. students in poor areas tend to have less access to quality schooling and extra help than residents of rich areas), thus it is specious to say that simply throwing money into an educational system will produce good results.
However, as you can see in the following maps detailing spending per student and average teacher pay, the amount of investment that a state puts into their educational system does have an effect on graduation rates.

Map created by NPR using 2010 census data
Map created by the Washington Post, using 2010 census and IRS data
As a general trend, states in the north spend more money on educating their students while southern states spend less—this trend largely parallels the trend in graduation rates. In short, the progressive ideal of investing in education is more likely to result in educational achievement than the conservative ideal of cutting taxes and social spending.
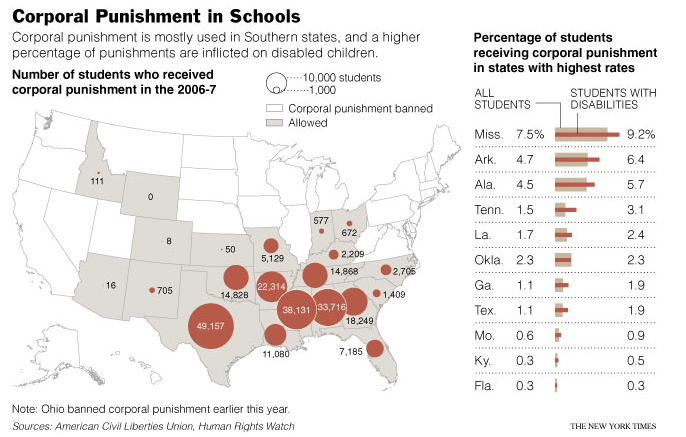
Map created by the New York Times, using data from the American Civil Liberties Union
In addition to having lower levels of educational achievement, right-leaning states in the south and Midwest account for virtually all instances of corporal punishment (hitting students) in the United States—this is simply because these states are the ones that have refused to ban the practices.
Health
Life Expectancy
Healthy years of life beyond age 65

Map created by Real Clear Science, using 2012 data
As the previous map illustrates, the right wing’s southern stronghold is composed of states that have, far and away, the worst life expectancies in the United States. This isn’t a purely a partisan issue, and involves a mixture of culture and bad policy.
The south is home to extreme poverty, a lack of accessible health care (ex. Texas leads the nation with 25% uninsurance), lax worker/environmental protections, and a culture that consumes massive amounts of fatty fried foods. These factors create a perfect storm of bad health that severely erodes the life expectancy of huge portions of the southern population.
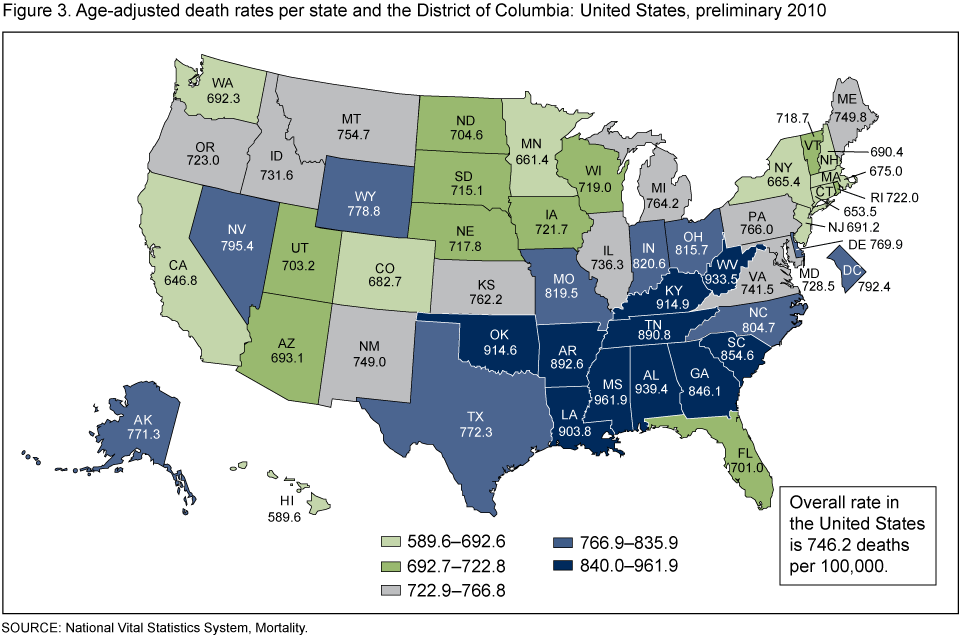
Given the lower life expectancies in the south, the trend in the following map, illustrating state-level death rates, is unsurprising.

Map created by the CDC, using 2010 data
As this map clearly shows, conservative southern states tend to have far higher death rates than more liberal areas. In fact, virtually every state with a higher than average death rate is either solidly right wing or leaning right (the exceptions being Ohio and Washington D.C).
Obesity, Diabetes, Stroke, and Heart Disease:
One of the primary reasons why the south has a lower life expectancy than the rest of the United States is that its people suffer from a variety of chronic illnesses. Rates of obesity, diabetes, stroke, and heart disease are far higher in these states than the national average, and people have often lacked the ability to access care.
The following map gives an overview of preventable deaths from medical conditions, color-coded by state.

Map created by the CDC, using 2010 Census data
When broken down into individual disease rates, the pattern of the above map is maintained. The following four maps give an illustration of the geographic distribution of obesity, diabetes, stroke and heart disease.
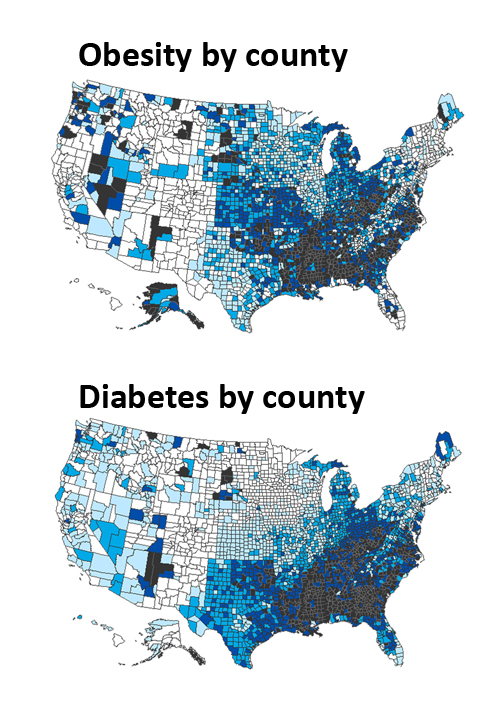
Maps created by Harvard University, using CDC health data
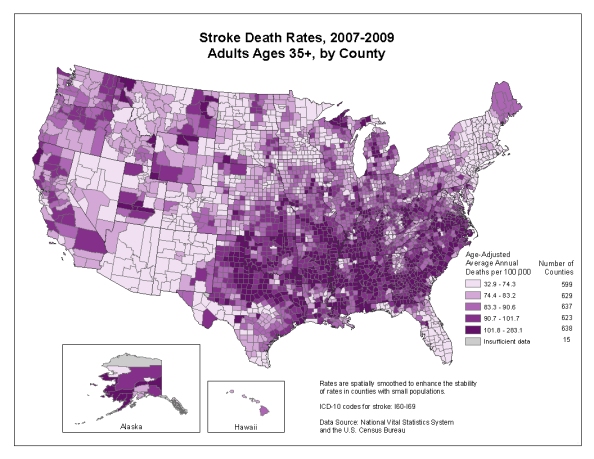
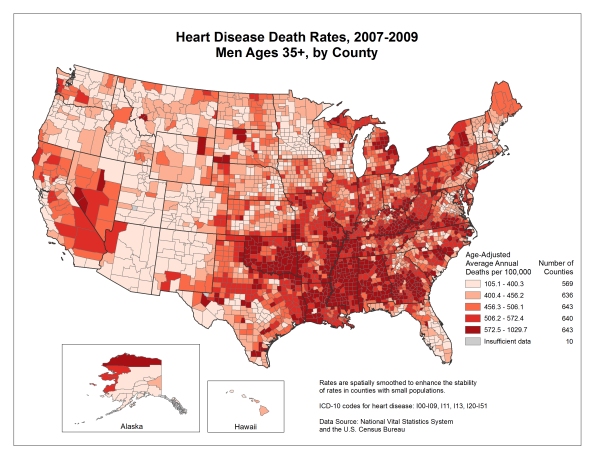
Maps created by the CDC, using 2010 data from the census and National Vital Statistics System
In effect, the south is suffering from a series of disease clusters that steal years of life from huge portions of their population.
Health Care
Given the lower life expectancies and higher prevalence of chronic diseases in conservative states when compared to progressive state, it is unsurprising that there are similar disparities in the quality/accessibility of health care.
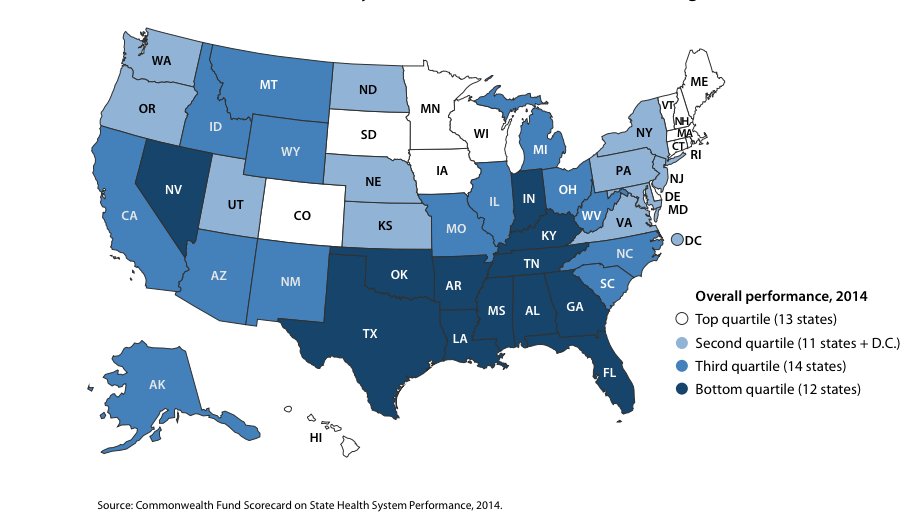
Map created by the Commonwealth Fund using 2014 data
As you can see in the previous map, the health care systems of the Deep South and southwest are the worst in the nation, while those in the northeast and north-central regions are the best. This defies a purely partisan divide (ex. a lot of rural states suffer from low hospital accessibility), but the fact remains that the most conservative states in the nation tend to have the worst health care systems. This lack of health care is a particular problem for the south because, as previously described, it is the site of such an epidemic of chronic and life-threatening disorders.
Unfortunately the health care systems of many conservative states appears unlikely to improve in the short term as, the conservative hatred for the Affordable Care Act has led numerous state governors to reject an expansion of Medicaid. This expansion would allow the poorest (and often sickest) residents of those states to access health care and the refusal to expand healthcare is estimated to risk thousands of avoidable premature deaths every year.

Map created by Avalare State Reform Insights
Teen Birth Rates
Right wing politicians tend to unite against birth control and abortion, while promoting abstinence-only sex education. Unfortunately, abstinence-only sex education doesn’t work, and because there is little access to reliable birth control for many individuals, states that are run by conservatives tend to have massive teen pregnancy problems.
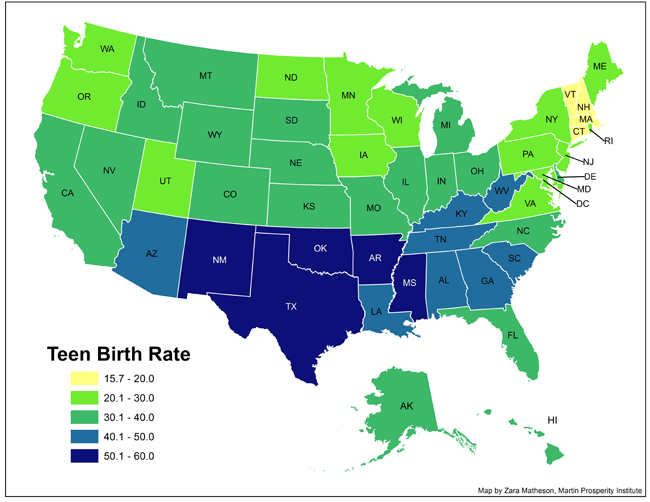
Map created by Zara Matheson of the Martin Prosperity Institute
The previous map illustrates teen birth rates for teenagers aged 15 to 19. The obvious pattern is that conservative southern states have far higher teen pregnancy rates, while northern states, particularly in the progressive northeast, have far lower teen pregnancy rates.
This pattern becomes even more extreme in the following map, which looks at teen pregnancy rates for children aged 10 to 14.
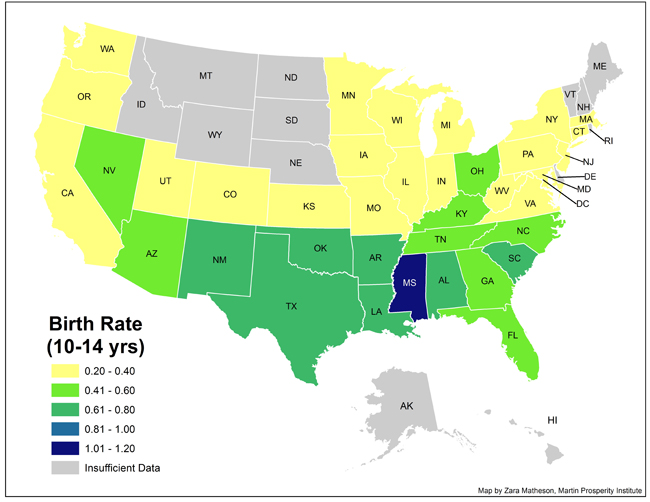
Map Created by Zara Matheson, of the Martin Prosperity Institute
Early teen pregnancy is a virtual non-issue for the north, but is a serious problem for the south. Over 1% of births in the state of Mississippi—the most conservative state in the nation—are from children between the ages of 10 and 14. This incredibly high teen birth rate is a massive problem, not only for the children, who often suffer from health consequences, but also for th mothers, who often have to drop out of school).
Culture/Crime
Religiosity
The American right wing has long been allied with a coalition of Christian religious organizations. Originally, these organizations were mobilized in opposition to the school desegregation movement, but they shifted to focus on restricting abortion in the late 20th Century and, more recently, to fighting advances in gay rights.
Given this alliance, it makes sense that there would be a correlation between the religiosity of a region and the likelihood that they would vote conservative (most highly religious Americans are Christians).

As you can see with the previous map, the right wing southern block is in thrall to religious adherence (mostly Evangelical and Baptist Christianity, with a Mormon outpost in Utah) to a degree not seen in any more progressive state. This isn’t to say that progressive states are secular, merely that their residents are, on average, less extreme in their religious adherence than residents of conservative states.
Guns
As the following map demonstrates, conservative states with weak gun control regimes tend to have significantly higher rates of gun homicide than progressive states. All of the most dangerous states in terms of gun violence are controlled by conservatives, with the exception of Colorado.

…and the conservative gun problem isn’t just contained within the borders of their states. As the following map shows, many guns used in crimes in progressive-leaning states with strong gun control regimes were trafficked from conservative states with weak gun control regimes.

Incarceration
As the following map illustrates, conservative states—particularly in the south—have significantly higher rates of incarceration than progressive state. Many of these incarcerated Americans are in jail for non-violent crimes, including millions of Americans who are simply non-dealers in jail for drug possession.
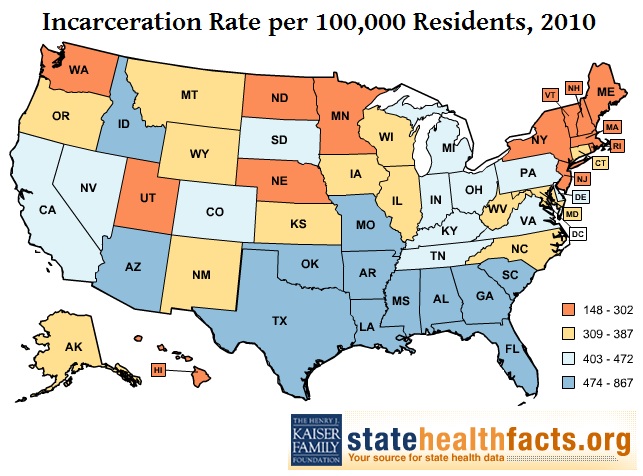
The reason that conservatives states tend to imprison more people is a combination of the right wing attraction to “hard on crime” policies, racially discriminatory policing, and the prevalence of poverty in those states.
Conclusion
When we look at all of these maps in totality, we are left with the inescapable conclusion that American conservatism is correlated with a less developed society. On average, states which are controlled by conservatives have poorer, sicker, and less educated populations than more progressive states; additionally, these states tend to have higher incarceration and unwanted pregnancy rates.
While there is a legitimate argument about the direction of correlation in this pattern—does conservatism stunt development or are stunted societies attracted to conservatism—this doesn’t actually affect the greater political narrative. If conservatism actively stunts society, it should be disregarded out of hand, while, if conservatism is just attractive to residents in stunted societies due to propaganda or social identification (ex. religious adherence), then it is merely ineffective in improving society. Either way, it would be foolish to want to expand such an ideology to more states or even to the federal government.
If you want to model your federal government on a state-level policy laboratory, what could possibly make you choose one of the conservative models over one of the progressive models (ex. picking the Mississippi education model over the Massachusetts one)? The weight of the evidence shows that, on average, conservative states not only have worse living standards than more progressive states, but are actually having their living standards artificially inflated with money redistributed from states which pay more to the federal treasury than the pay in.

I appreciate all the work put into this report, however most of the data used is several years old. I would think that some, if not many, things have changed since then. I’d like to see how things have changed since the Obama administration has been in office.
LikeLiked by 1 person
There are three reasons why I couldn’t/didn’t use 2014 data for this article:
1) A lot of this data is dependent upon census information, and censuses are only done every ten years (2010 was the most recent one).
2) Most official agencies (ex. the CDC) back-load their reports by several years, making it impossible to find post 2012 information. I used the most current data that I could find in these cases.
3) The federal government is largely paralyzed and most recent policy has been passed through the states. This means that Obama’s presidency is not as large a factor in policy than the state-level political powers (ex. the TX legislature has far more of an influence over TX policy than Obama).
LikeLiked by 1 person
An excellent resource guide, thank you! While as stated, the information may be a few years old, it does not stretch the imagination to believe these statistics have only gotten worse in red states – with the exception of those few whose governors ( ex. Kentucky, Arizona, etc.) have finally agreed to accept the ACA Expanded Medicaid funding.
Shared on the New NY 23rd blog.
LikeLiked by 1 person
I see you mentioned nothing about the border states that have been overrun by the south-of-the-border hordes.
That certainly contributes negatively; no surprise it’s not mentioned.
Playing games with stats to support your own political prejudices hardly validates you as a “fact teller.”
It just makes you look like a tool of socialism.
Useful idiot, if you prefer.
LikeLike
Ironically, the only things that keep the southern economy afloat are blue-state socialism which sends them money and illegal labor which supports their farming economies. Additionally, undocumented immigrants contribute a huge amount in sales, gas, and withholding (they contribute under an assumed name, but cannot withdraw benefits) taxes.
Your blatant racism aside, you are simply and amazingly wrong. Socialism has its place in every developed society (ex. the military, public education, the police, firefighters, water treatment, etc.) and, if you fail to recognize this, you are either ignorant, blinded by ideology, or too stupid to understand the issues. Which are you?
LikeLiked by 7 people
So what do you think of this data? I would like to see this explained in your article as well…http://www.washingtonpost.com/wp-srv/special/politics/state-budget-crisis/
You will notice that republican states tend to be in much better shape here…
LikeLike
When you feel threatened, go ad hominem. Definitely makes you “look” like something other than an idiot. Useful? Nope.
LikeLike
Pingback: Graphic Sources: Baptists, Protestants, Poverty, Disease, Abuse | Amateur
Pingback: Sixteen states have more people in prison cells than college dorms | theGrio
Pingback: Sixteen states have more people in prison cells than college dorms - UNR
Pingback: Sixteen states have more people in prison cells than college dorms | BossFM | #TheHashtag
Pingback: BossFM – Sixteen states have more people in prison cells than college dorms
Pingback: Sixteen states have more people in prison cells than college dorms | BossFM | Vibe 105
Pingback: Sixteen states have more people in prison cells than college dorms | CE Marketing & Promotions
Pingback: Incarceration Rates
Pingback: Pick 6 (4/3/15) | Root & Rebound
Pingback: 16 estados do EUA têm mais pessoas em celas de prisão que dormitórios da faculdade | BiDê Brasil
Pingback: Números assustadores da maior população carcerária do mundo
Pingback: EUA: 16 estados têm mais pessoas presas do que em dormitórios de faculdade - Bem Blogado
Comparing Red vs Blue states is flawed (and I’m sure you know this), because in any red state the numbers are wieghed down by municipal governments that are ran by progressives. Missouri is a red state but is skewed by blue St Louis that is far behind the rest of the state in poverty, graduation rate, crime and so on. Then there is red Kentucky the has Louisville, a liberal city that doesn’t meaure up to conservative Lexington. And so on. On the other hand, New York, for example, is a blue state because NYC holds so much weight, but the rest of the state is red and has better numbers. You’re really stacking the deck going state to state. Compare the top conservative cities vs the top liberal cities and it’s an embarrassing loss for progressives.
LikeLike
Well David, you talk the talk. Can you walk the walk? It’s easy to pick out isolated instances in data. Much more difficult to produce a detailed report showing clear trends, as jseger has done. Let’s see you back up your claim with hard facts and data. Otherwise it’s just a weak counter claim with no evidence what-so-ever that can be just as easily dismissed.
LikeLiked by 1 person
Unfortunately, all too many people think that their assertions trump reality, particularly when they have an ideological ax to grind. He can’t recognize the failure of red states because that would destroy his central political ideology and leave him completely uncertain about what to believe–as this is uncomfortable, it is far easier for him to live in the a fantasy world and he has no incentive disprove his own fantasy.
LikeLiked by 1 person
David,
Sorry that this took so long (my blog didn’t alert me to your new comment until Paul commented on your’s).
Actually if you look at the data, you are demonstrably wrong. For example: here is Time’s map of SNAP enrollment by county, sortable by Congressional district and partisanship: http://swampland.time.com/2013/12/04/interactive-republicans-more-likely-to-have-constituents-who-use-food-stamps/
As you can clearly see, Republicans control far more high-SNAP enrollment areas (both area and population). SNAP enrollment is a widely accepted measure of economic well-being, and is just one such example of this trend bearing out on the local level.
Beyond that, you cannot discount the reality that state government have a massive amount of control over local politics, thus ignoring the fact that red states tend to be failures is simply a way to protect the Republicans. States control EPA and health policies (ex. accepting or rejecting the ACA, regulating hospitals, etc.), set limits on local taxation (ex. Prop 2.5 in MA), and set the economic tone for the entire state (ex. funding state colleges, economic incentives for investment, transportation infrastructure projects, etc.). In short, red states that deregulate, refuse to enforce worker protections, fail to invest in education or infrastructure, and pass regressive tax codes (ex. relying on state property and sales taxes) regularly and predictably fail when compared with blue states that do the opposite.
Try to get over you ideological partisanship and look at the facts.
LikeLiked by 1 person
I agree with your post, but initially had to readjust my thinking as I was raised with the colour ‘Red’ referring to Left wing politics, and ‘Blue’ referring to Right wing politics. I may be mistaken, but I think this change came about back in the 80’s.
LikeLike
My response, above?, was meant to be directed to David, while its’ placement seems to indicate differently.
LikeLike
Who was it that said “There are three kinds of lies: lies, damned lies, and statistics.”?
LikeLike
Somebody who didn’t like or understand what the statistics say about them.
LikeLiked by 1 person
Is that meant to be an example of the first kind or the second kind?
LikeLike
A question relating to the NOVEMBER 16, 2014 AT 10:52 PM post.
The “Southern economy” you refer to is comprised of which States?
And a response from knowledge acquired while once living at an apartment complex where many illegals, some hispanic and others Asian, were also living. In addition there were a number of persons both hispanic and Asians who were legal immigrants also living among us. Those who were illegal would use the Identity of the legal residents and their Social Security number to acquire work, and most everyone I knew was earning $10-$15 or more an hour and filing income taxes, although in most every case I was aware of receiving a full refund or more, while the legal resident did not have to work but would later benefit from the FICA taxes collected under their social security number.
Not only that, but many of my Asian friends who were in reality several years younger than me showed me that according to their papers and ID issued by the American government were several years older than me. Since no real birth records existed they were told, by some government agency employee, they could fudge their birth date and rather than claim to be younger, claim to be older making them eligible for age related benefits at an earlier age.
I think it should be recognized as fact that people, both Liberal and Conservative, or for that matter of any political persuasion will most often if not always do what they feel is in their own best interests, and to go even further will do or support many more things if the cost is applied to others.
LikeLiked by 1 person
Pingback: As the Peacock Struts: are liberals more competent than conservatives? | evolutionistx
Pingback: The correlation of high religiosity in America with everything bad « Why Evolution Is True
Pingback: Links and Comments: Religion and Science | Views from Crestmont Drive
Pingback: Straight Outta The South |
I am an engineer but very interested in political data crunching. I grew up in conservative Texas.
I think you have made a few assumptions that are questionable.
You suggest that conservatism may not be effective at improving society. One could argue that the question was flawed because a philosophy like the cons do not necessarily care about improving society whatever that means. I am educated yet if people in red states choose not to be educated that is their own private decision and I should respect them for that. As far as progressives are concerned their seems to be an obsession with longevity, education, and money that not all care about.
My financial success, education and so called accolades are meaningless, arbitrary metrics. Quality of life is more important than quantity for some. your values dictate what is so called good and important but no more objectively important than other values that others might hold. If money is unimportant poverty is not important, and so on. Measuring yourself against others in some sort of competition is also arbitrary and capricious. your standards are no more objective than the thumpers who insist on creationism.
LikeLike
Some things to keep in mind:
The most conservative states also have the highest numbers of Black, Brown, and Native American populations –
https://en.wikipedia.org/wiki/List_of_U.S._states_by_African-American_population
https://en.wikipedia.org/wiki/List_of_U.S._states_by_Hispanic_and_Latino_population
https://en.wikipedia.org/wiki/Native_Americans_in_the_United_States#Demographics
These groups have high rates of crime, teen pregnancy, obesity levels, lower educational achievement, etc. –
http://www.hhs.gov/ash/oah/adolescent-health-topics/reproductive-health/teen-pregnancy/trends.html#
https://nces.ed.gov/fastfacts/display.asp?id=16
https://en.wikipedia.org/wiki/Race_and_crime_in_the_United_States#Crime_rate_statistics
http://www.gallup.com/poll/155735/blacks-likely-obese-asians-least.aspx
LikeLike
One of the significant flaws in this piece is that it completely ignores the historic and extremely deep divide in economic opportunity between blacks and whites in the South. This divide has existed long before the current Red/Blue map you base the argument on existed. Your entire article is bunk because you confuse correlation with causality. Nice try though. Interesting charts.
LikeLike
Pingback: A Hypothesis on Crime Rates in American States | The American System and Its Discontents
Pingback: A Cold Civil War is Still Being Fought - Legal Reader
If you believe this crap, you also believe that unemployment is at 5%, polar bears are drowning, the earth is flat, 0bummer is a good president….
LikeLike
I do not think he mentioned causality even once, except at the end. Where he asked if the conservatism being popular if that is the reason statistical data is the way it is or the statistics is the reason the conservatism is so greatly preferred in those areas? The correlation is very very strong, what amazes me is, all the disgruntle attitude from the voters from these states about tax etc…. The coastal states who are always looked down upon as liberals should be complaining. Also I think with the kind of election, the coastal states should stop paying federal taxes, and decide to only pay state taxes, let these guys take care of themselves, lets see how much Mr Trump saves them.
LikeLiked by 1 person
Reblogged this on Equine Preservation of North America -EPONA and commented:
Until we understand how we have a climate change denier POTUS in office, appointing people that we all know will do more damage to our animal ethics, environmental policies, and damage to our society in general, we must learn how we got here and more importantly, #resist.
With the current transition team directing the coming administration actors, policies, etc. if we are not careful in where we fight our battles, we will never be able to win the war. This important fight will be for our very lives and the lives of the most vulnerable among us, along with the generations to come.
Researching why Republicans were able to take over our government, I found this amazing research by Josh Sager that will explain the insane rhetoric that made this madman the next President of the United States, based solely on lies in order to manipulate these vulnerable, impoverished fellow Americans.
We must education and do our level best to expose this fraud. Knowledge is indeed our power against the ignorant.
LikeLike